

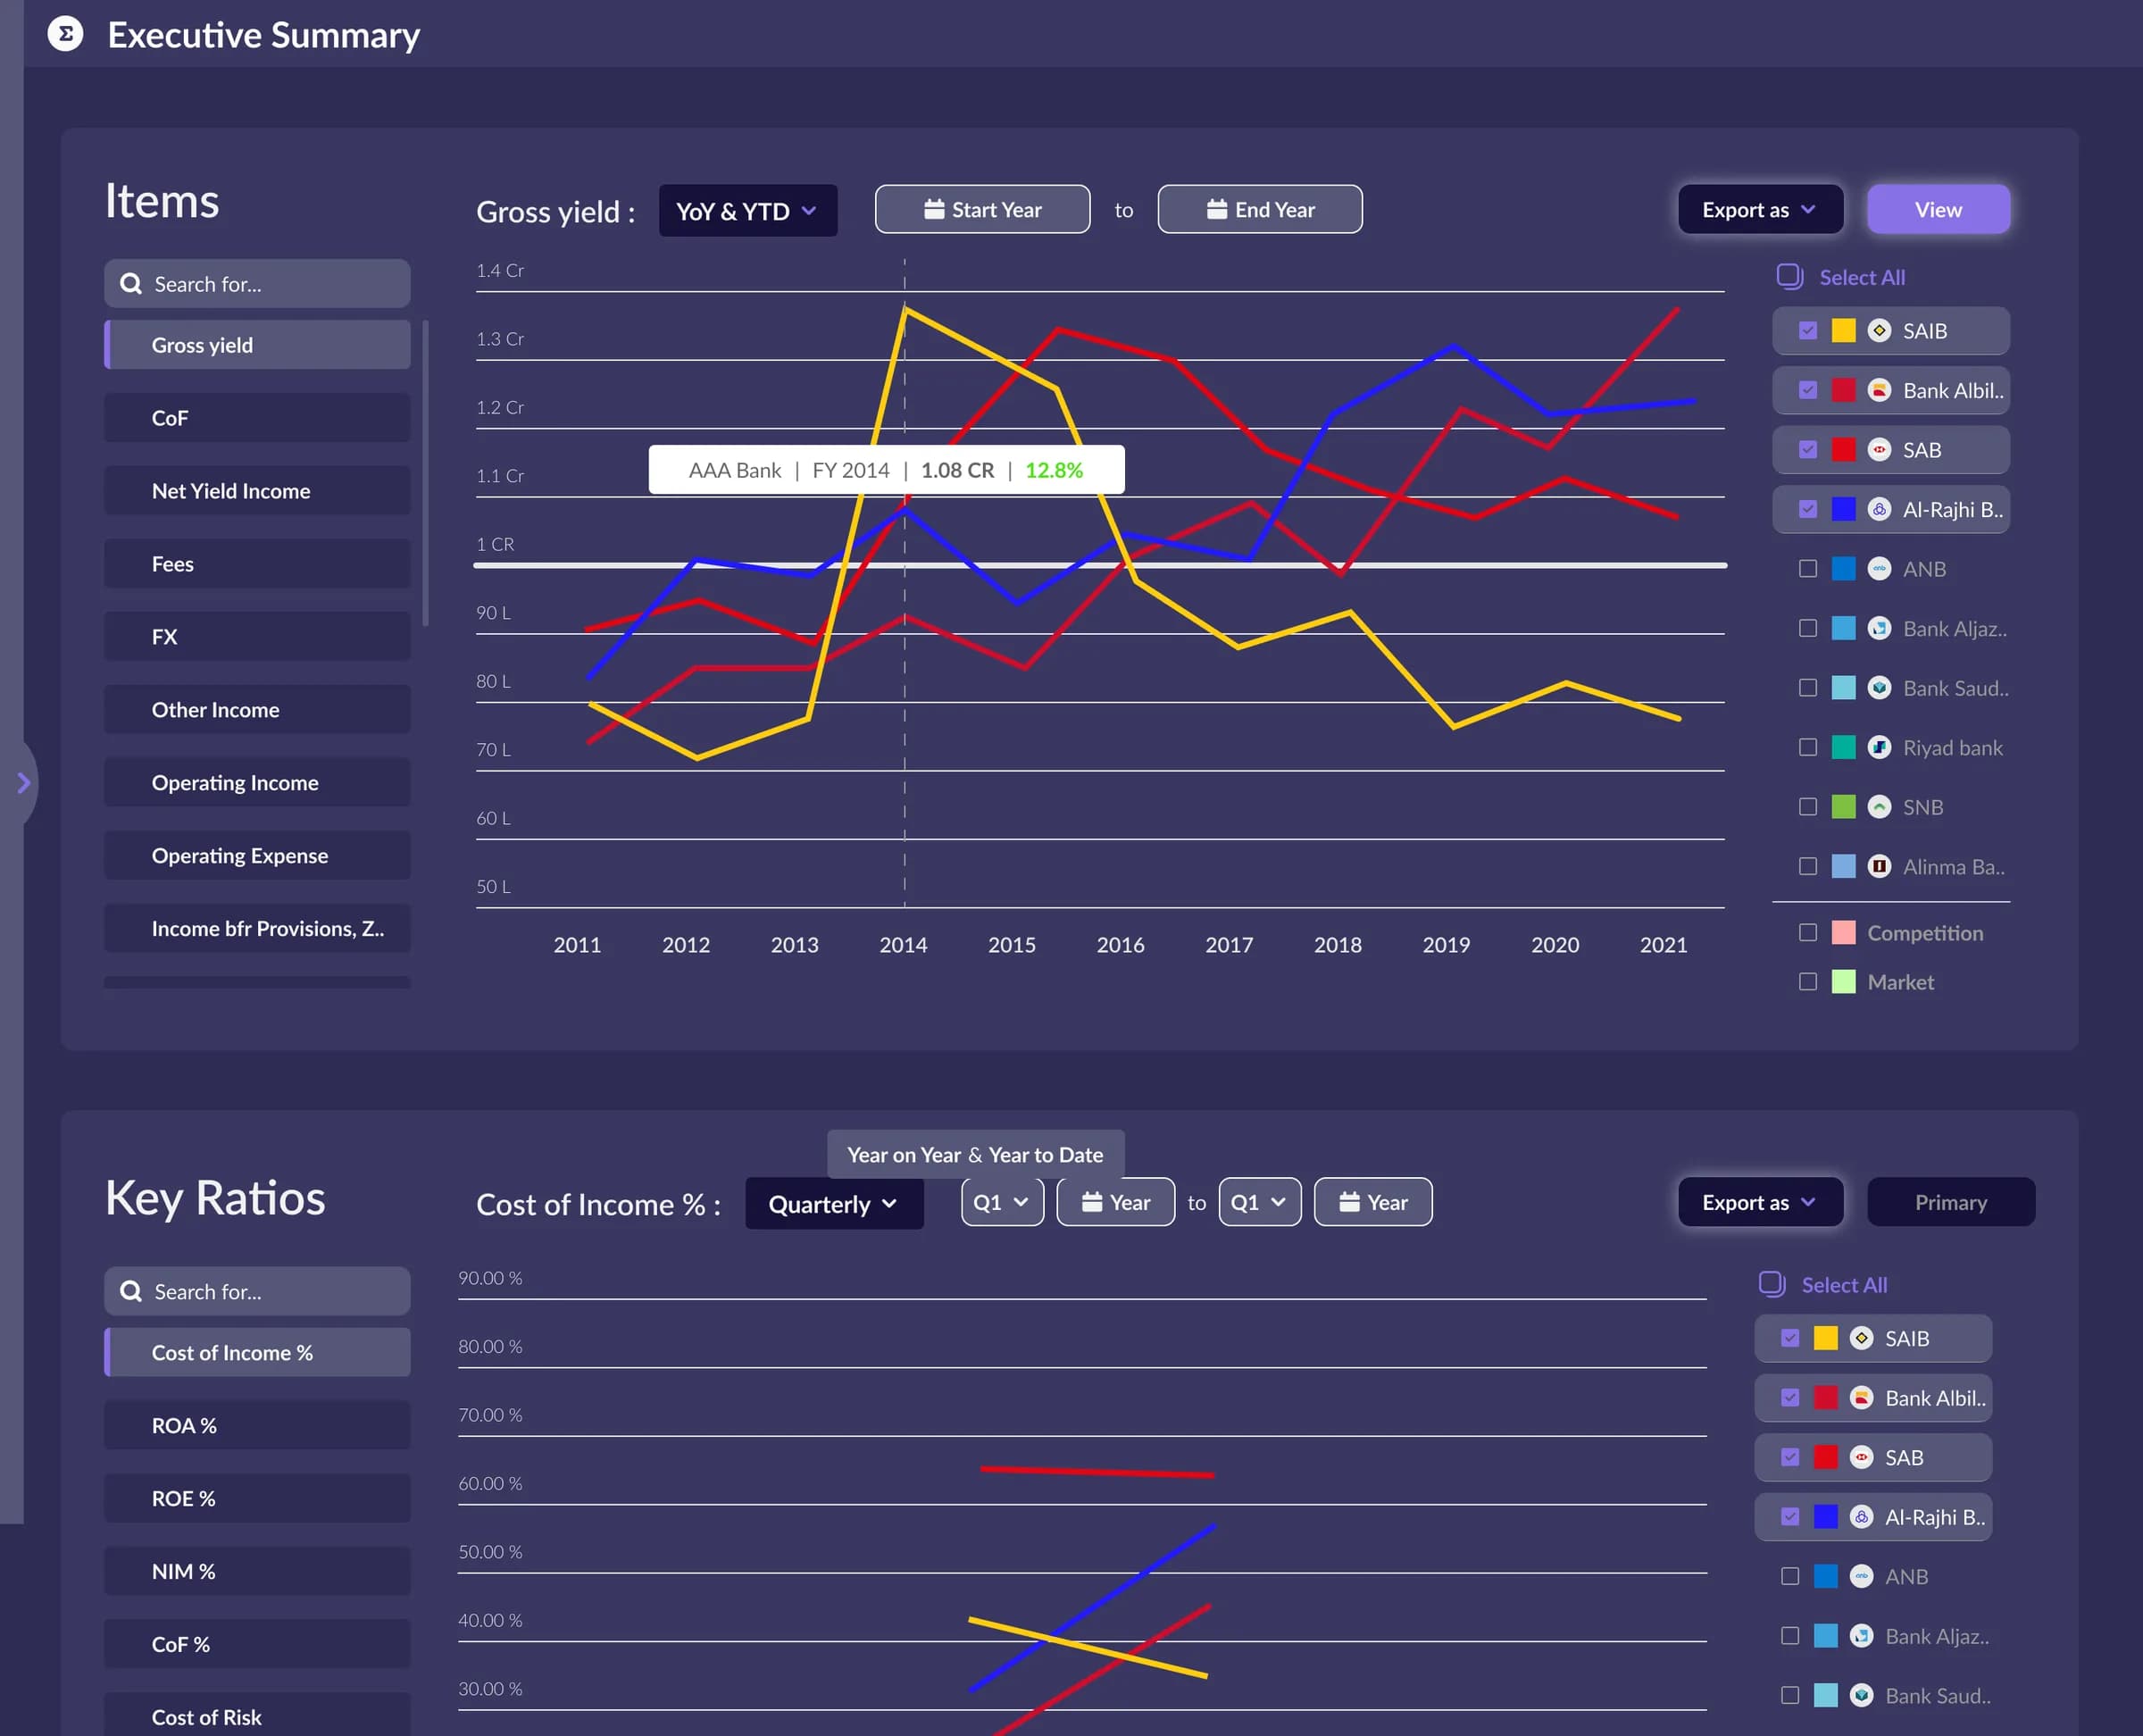
Every bank's numbers are published. Comparing them is still manual: the disclosures sit across regulatory filings and annual reports, the formats differ between institutions and between years, and by the time an analyst has assembled a comparable view the quarter it described has moved on.
Benchmarking gathers publicly available bank data and puts it into a form where one bank can read a competitor's position quickly — built as a product to be sold to banks, rather than as an internal analysis tool for one of them.
Public does not mean usable
The data being open is the start of the problem, not the end of it. It arrives in documents built for disclosure rather than analysis, with definitions that shift between institutions and reporting periods. The engineering is in the ingestion and the normalisation, which is also why the result is worth paying for.
Comparability is the product
Two banks reporting the same line item are not necessarily reporting the same thing. Deciding what is genuinely comparable — and being explicit where it is not — is what separates a benchmarking product from a spreadsheet of scraped figures.
Built to be sold, not just used
A tool for one bank can assume one point of view. A product sold to many has to let each subscriber see itself as the subject and everyone else as the comparison set, with strict separation between what each can see. That requirement shapes the data model from the first table.